Context
With over 700MWh under development worldwide and e-Mobility solutions – deploying 50,000 charging stations for electric vehicles across Europe. In July 2021 TCC, one of the pre-eminent industrial groups in Asia with over $10 billion market capitalization, completed the acquisition of 60.5% of Engie EPS for an Enterprise Value of €240 million.
What I did
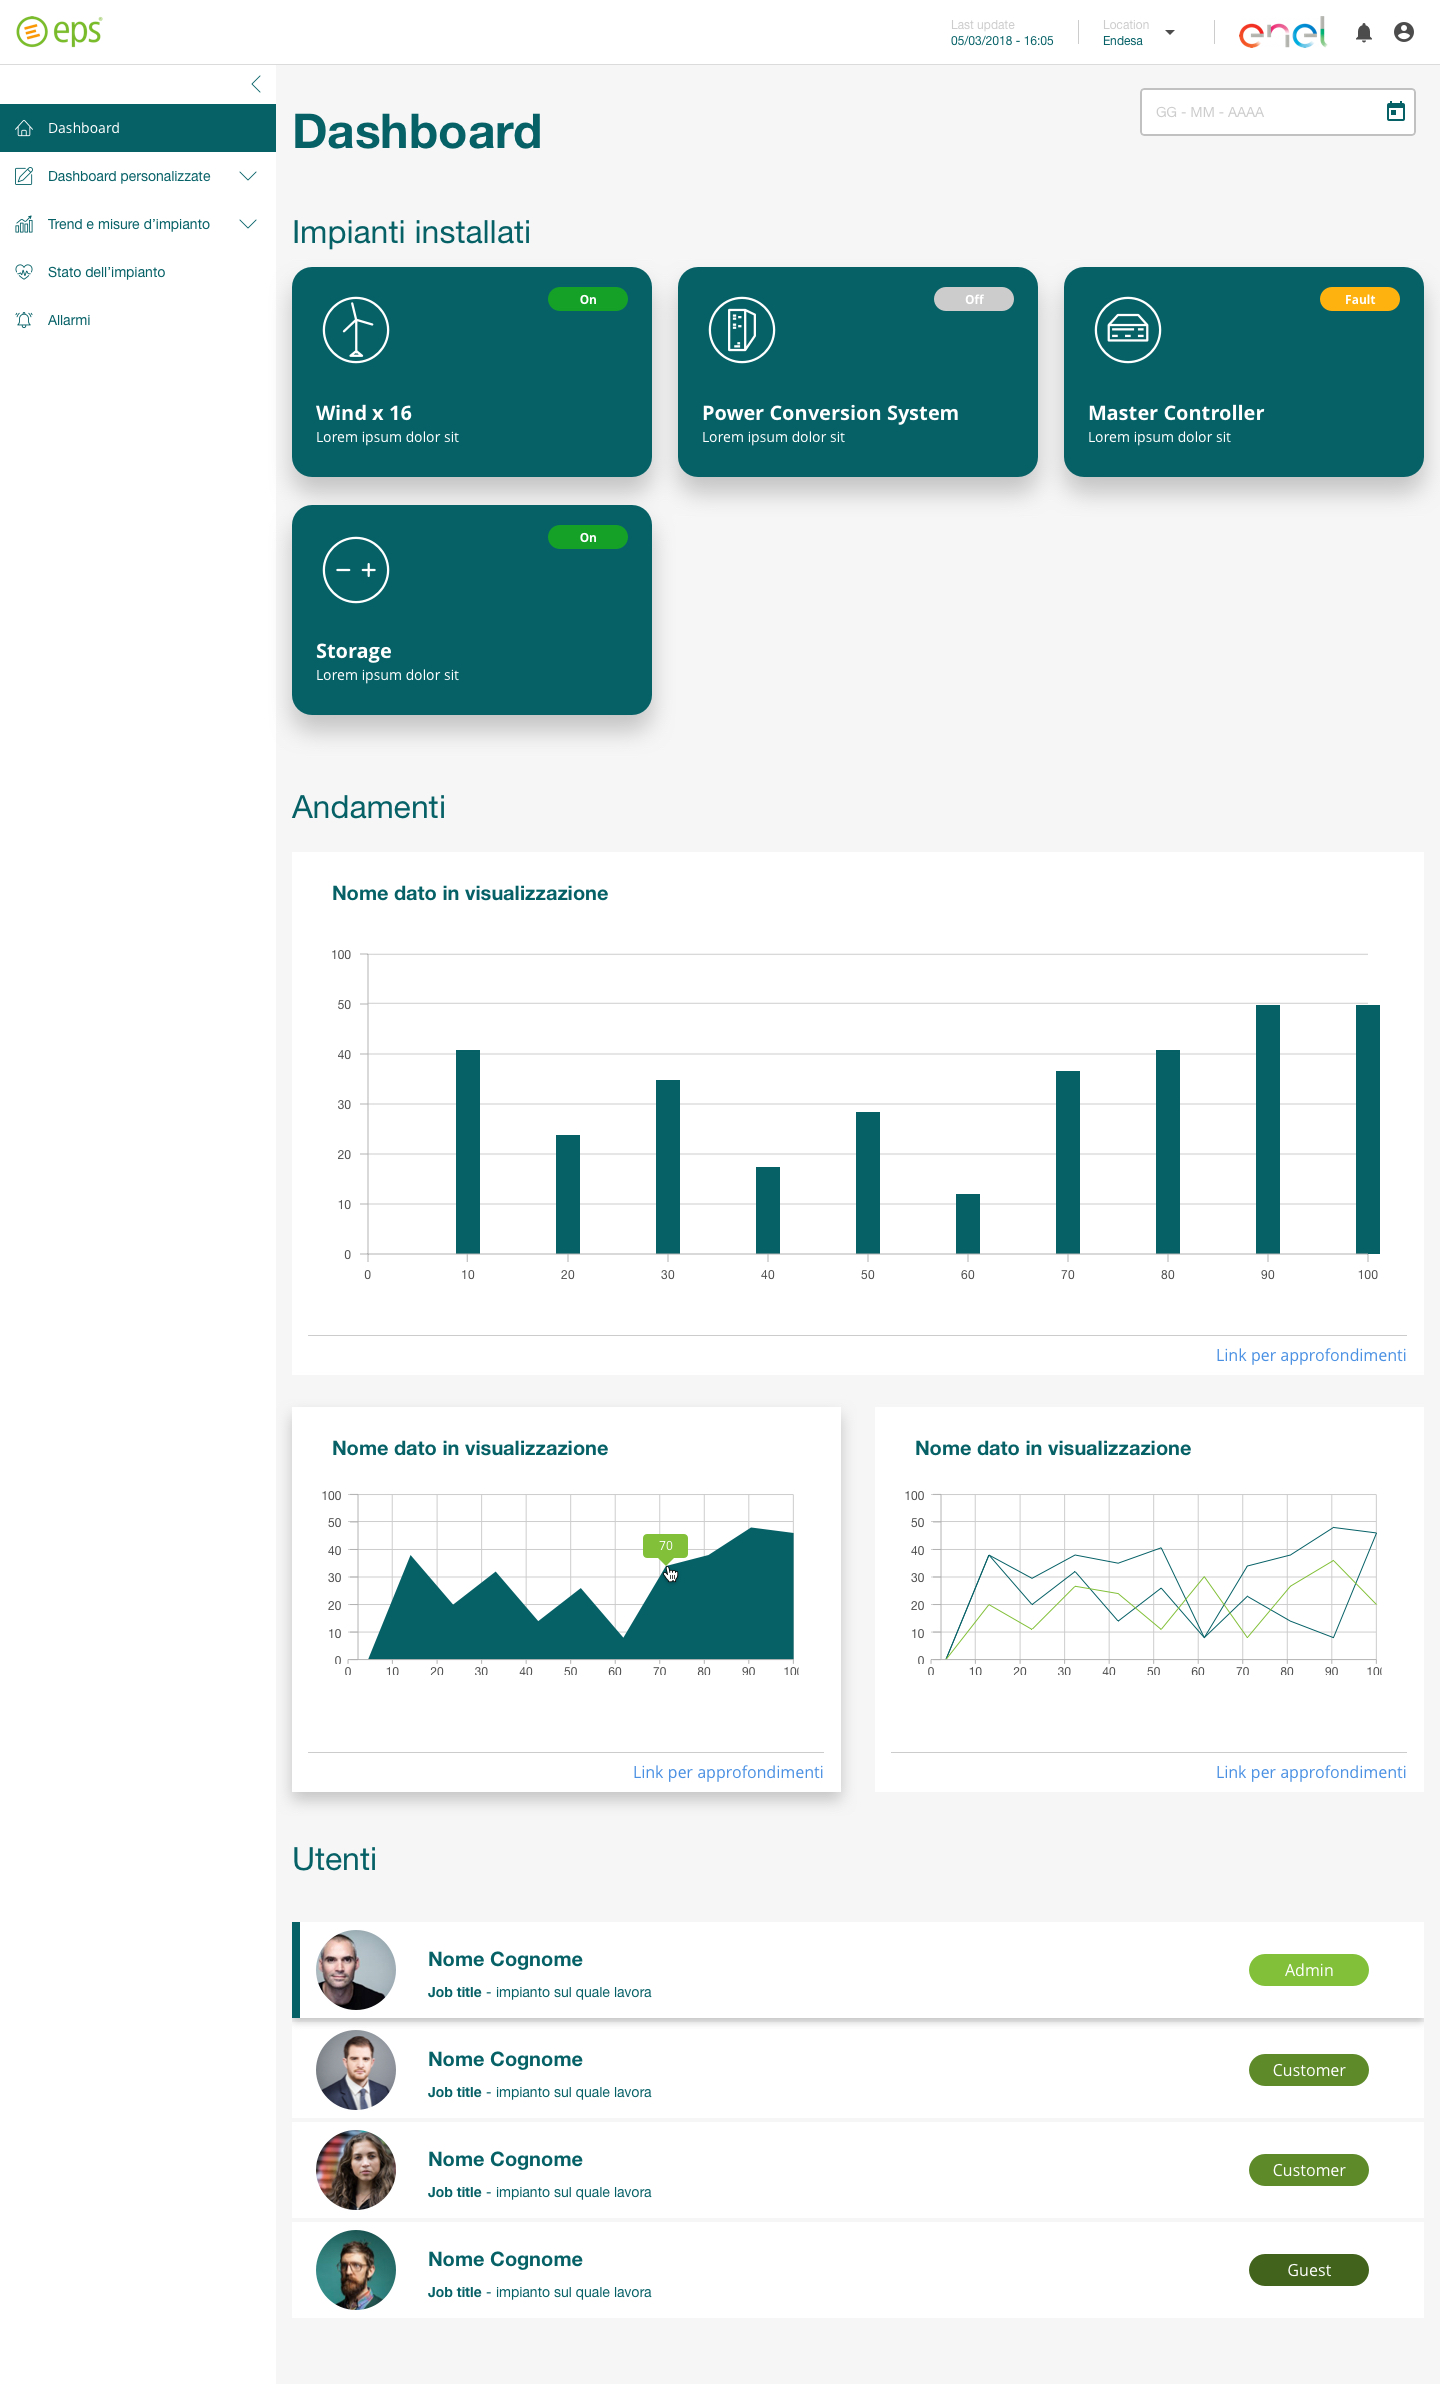
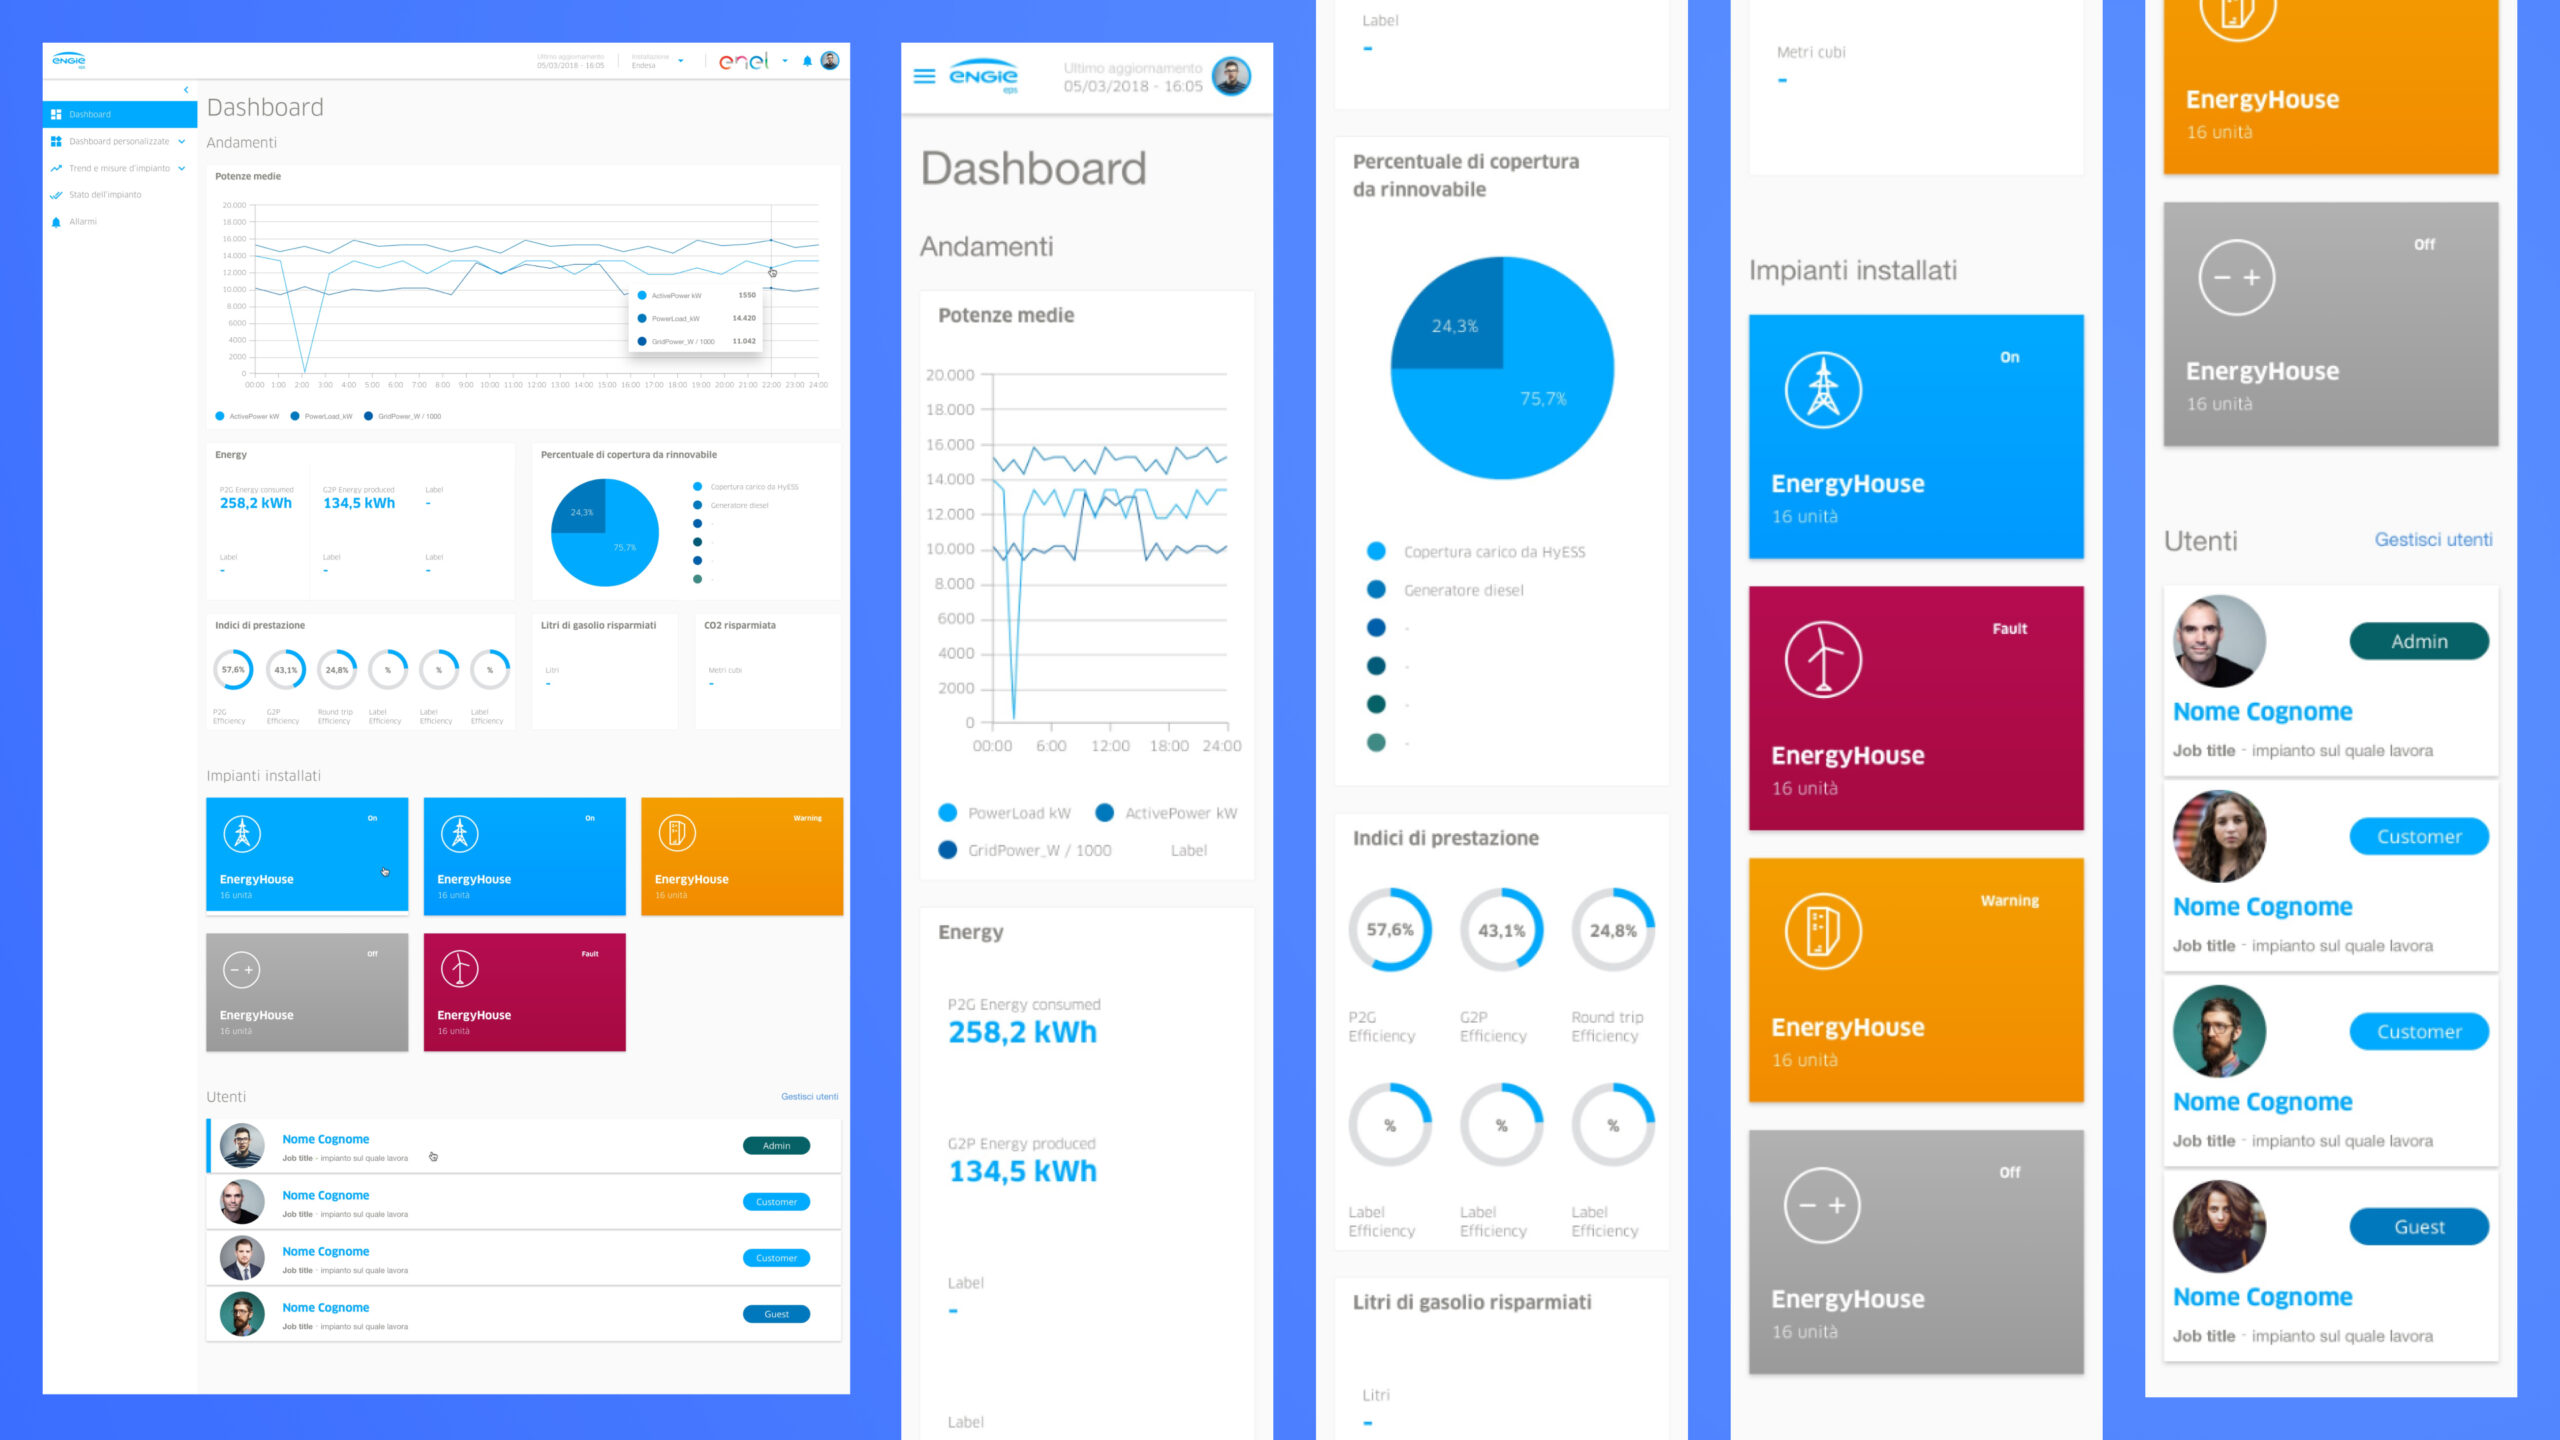
I was responsible for designing a web app for visualising plant data on a global scale.
The data is aggregated on different dimensions: by customer, geographic area and with the possibility to drill down on specific machines. The project also included the possibility of customising and exporting reports directly from the web app.
Discover
How many and what types of users will use the platform? What data is important to them and at what level of depth? Are there roles and permissions to be taken into account for visualisation and editing functionalities in the platform?
Understanding the context
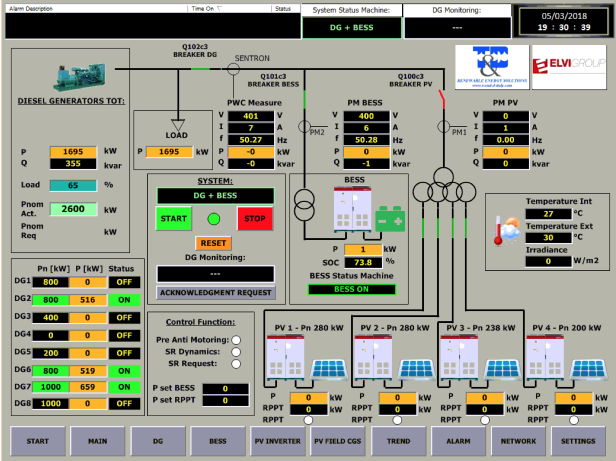
The greatest difficulty was to quickly learn the context. The client provided all the technical specifications of the installations and showed how the installations were managed.
The continuous work also in the other phases was to make the information and functions clear, giving the interface a high level of readability and discoverability of the information.
Understanding the users
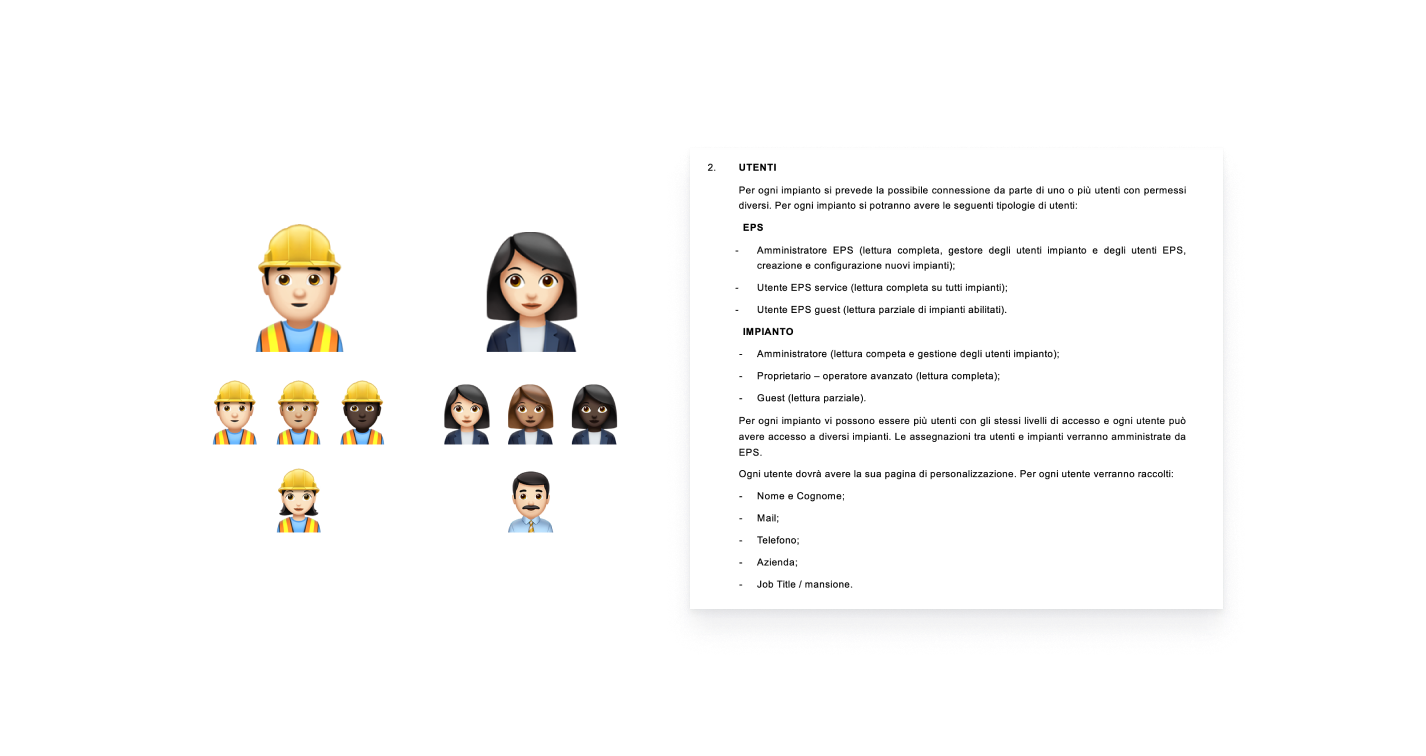
A proper definition of the users and the relationship between them made me realise the complexities of information visibility. Once the users and their relationships had been defined, it was possible to work on the logic of navigation, filters, complexity and depth of the information to be displayed.
Define
Information & function
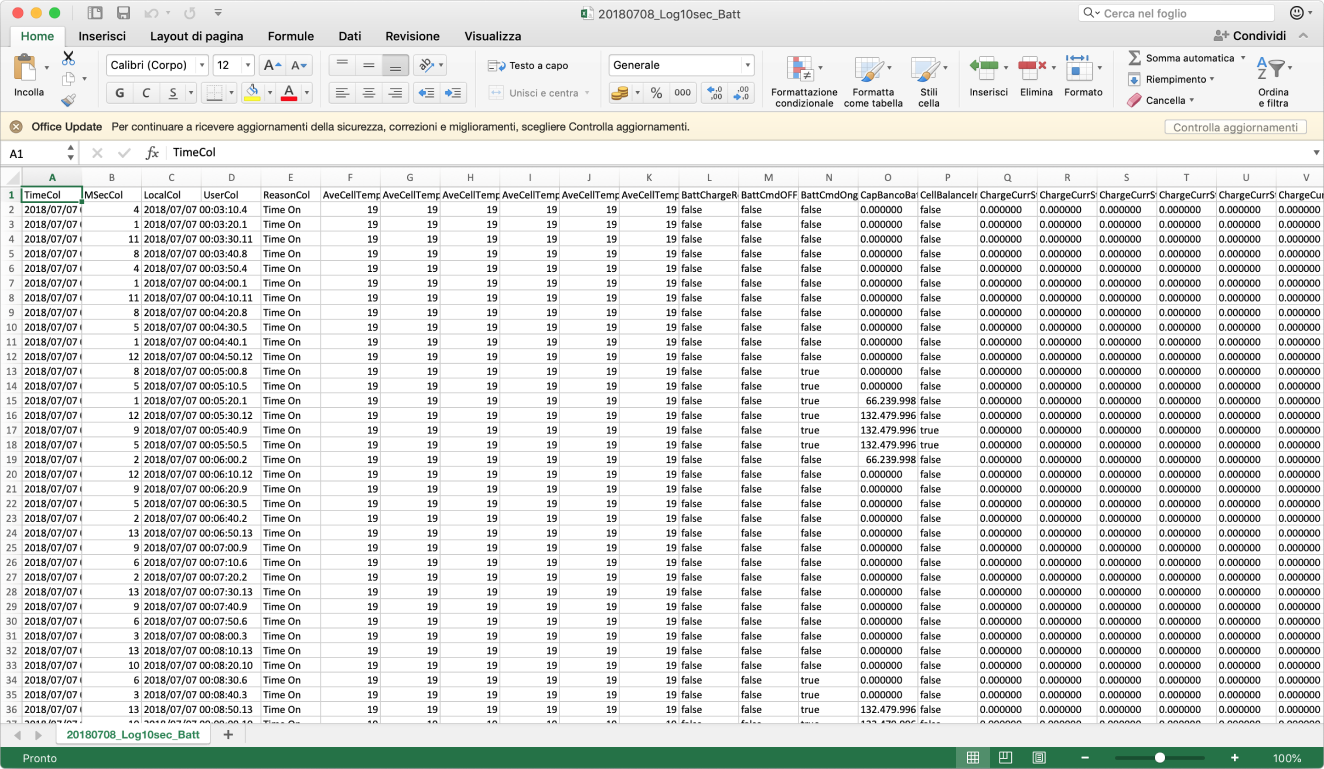
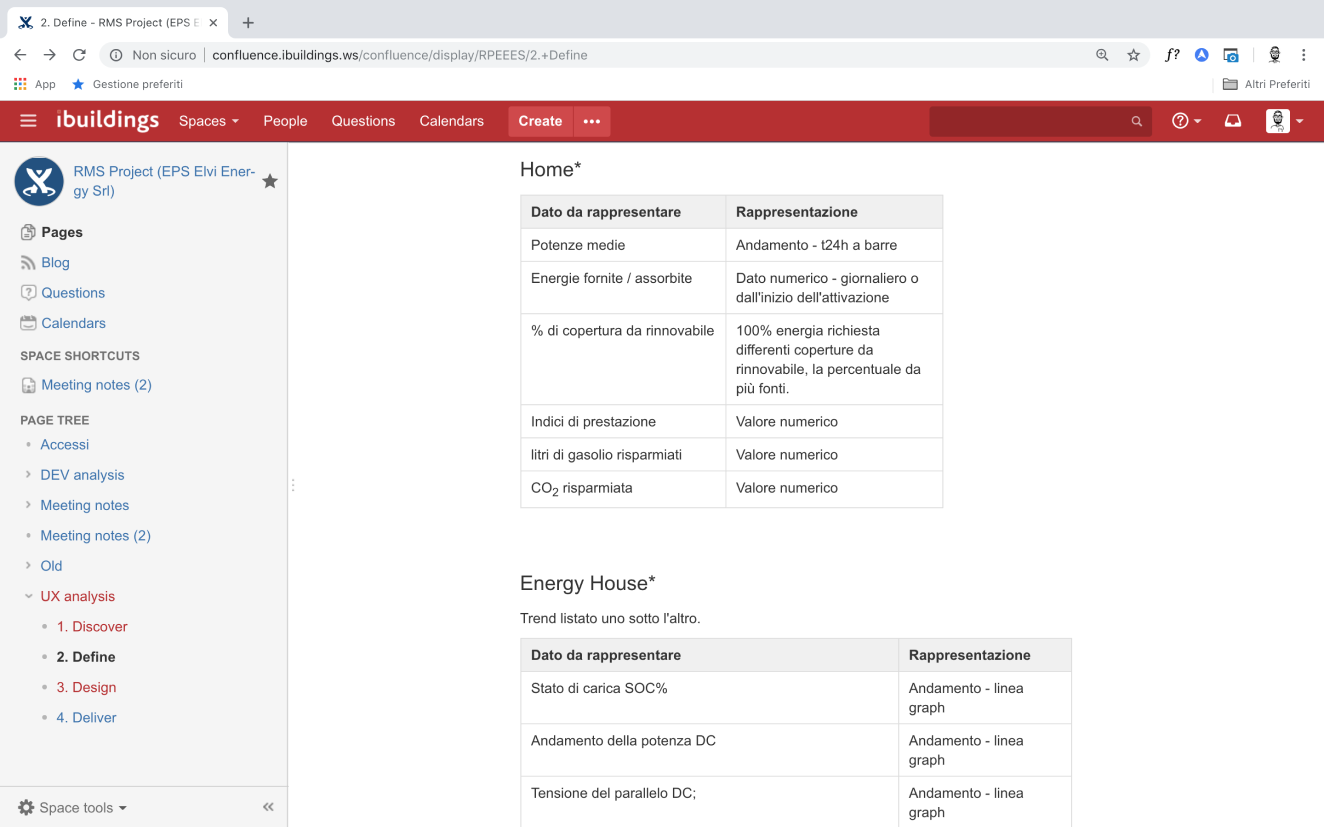
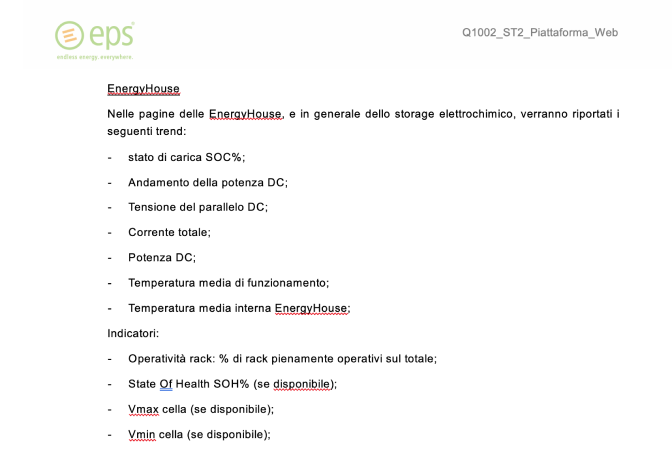
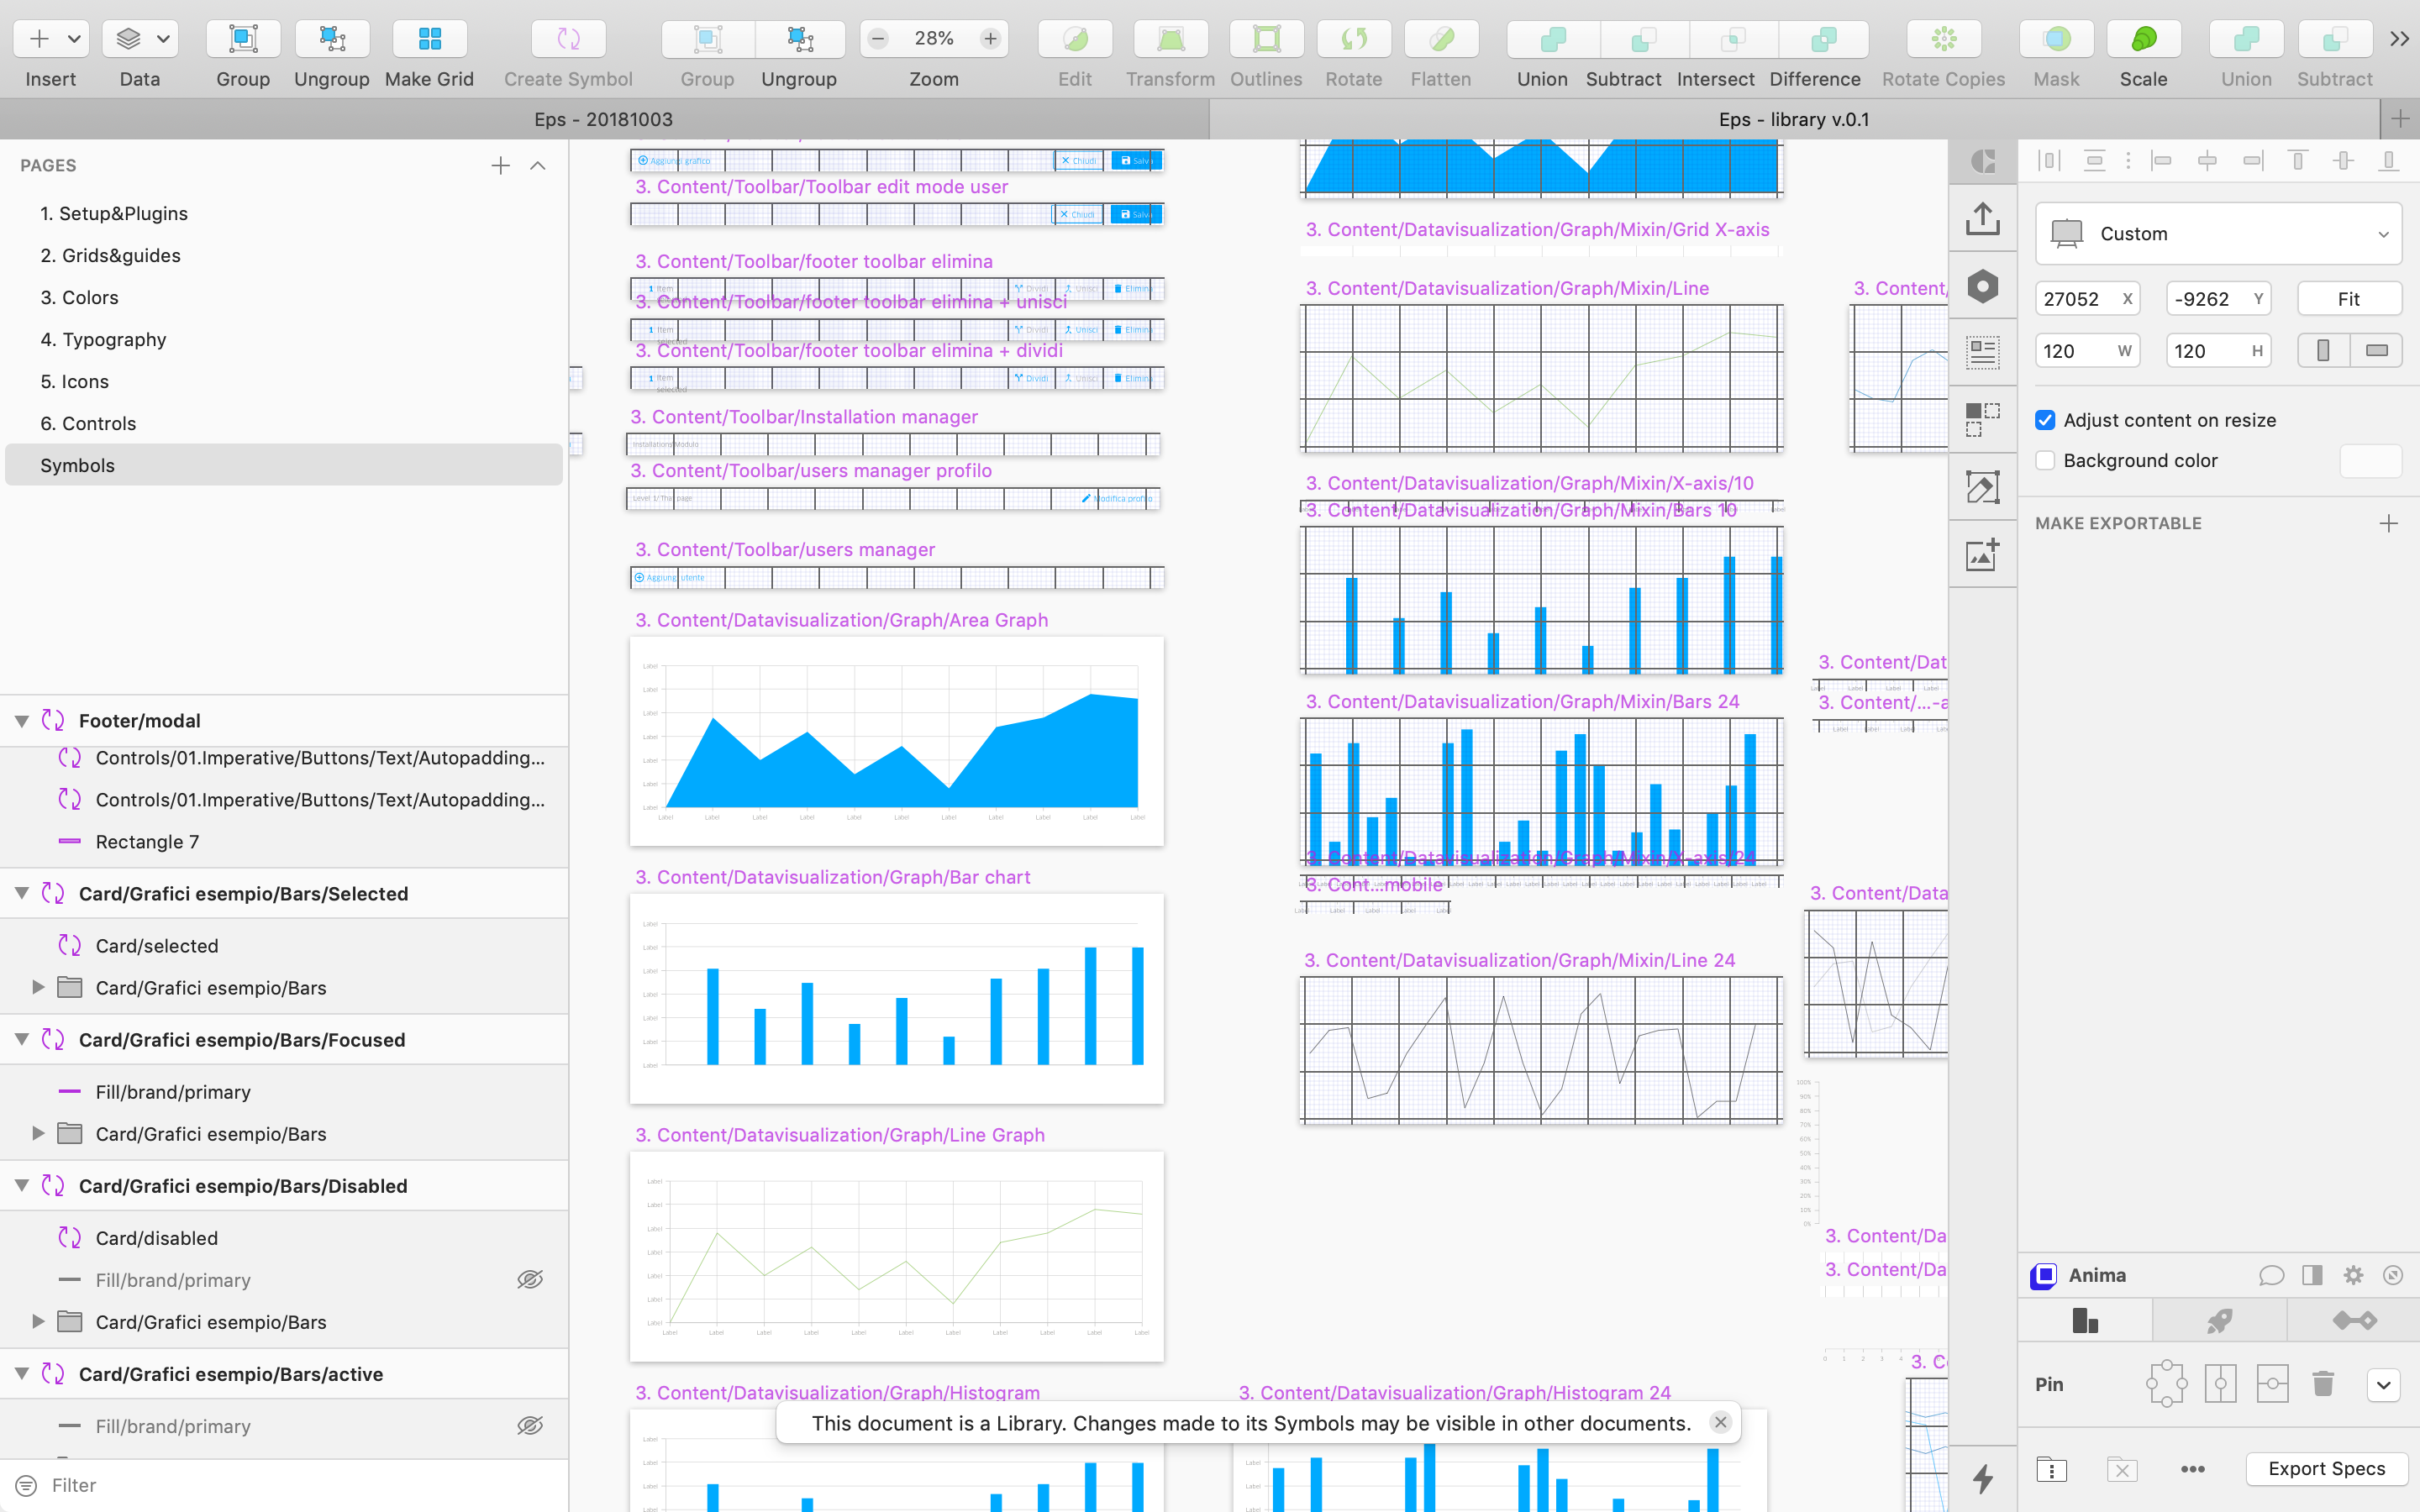
Once the context and users were defined, another piece of work was started with the client to figure out what data to show and how. Starting with the historical data set, we went on to figure out what data to show at the various depth levels. To do this, we shared the confluence pages containing tables that grouped the data by screen and indicated the order in which it was displayed.
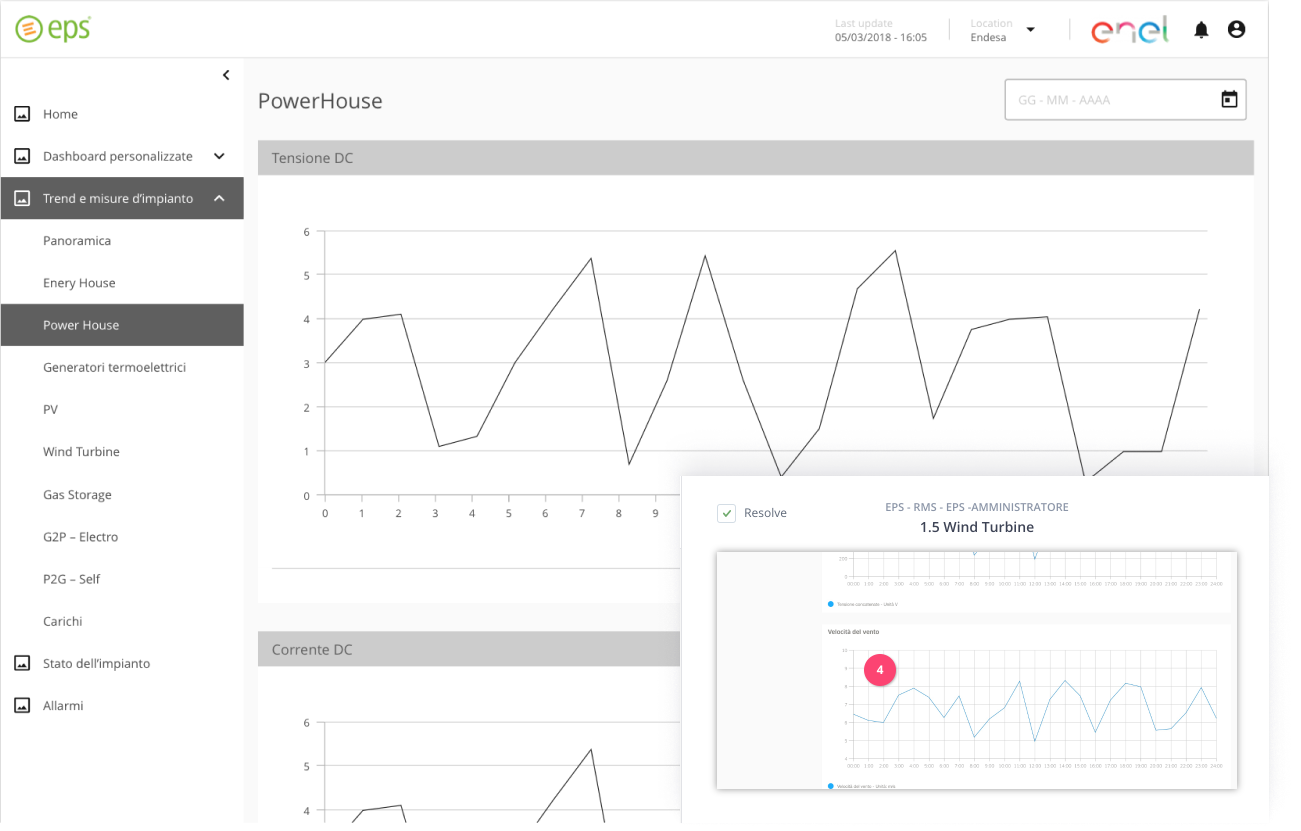
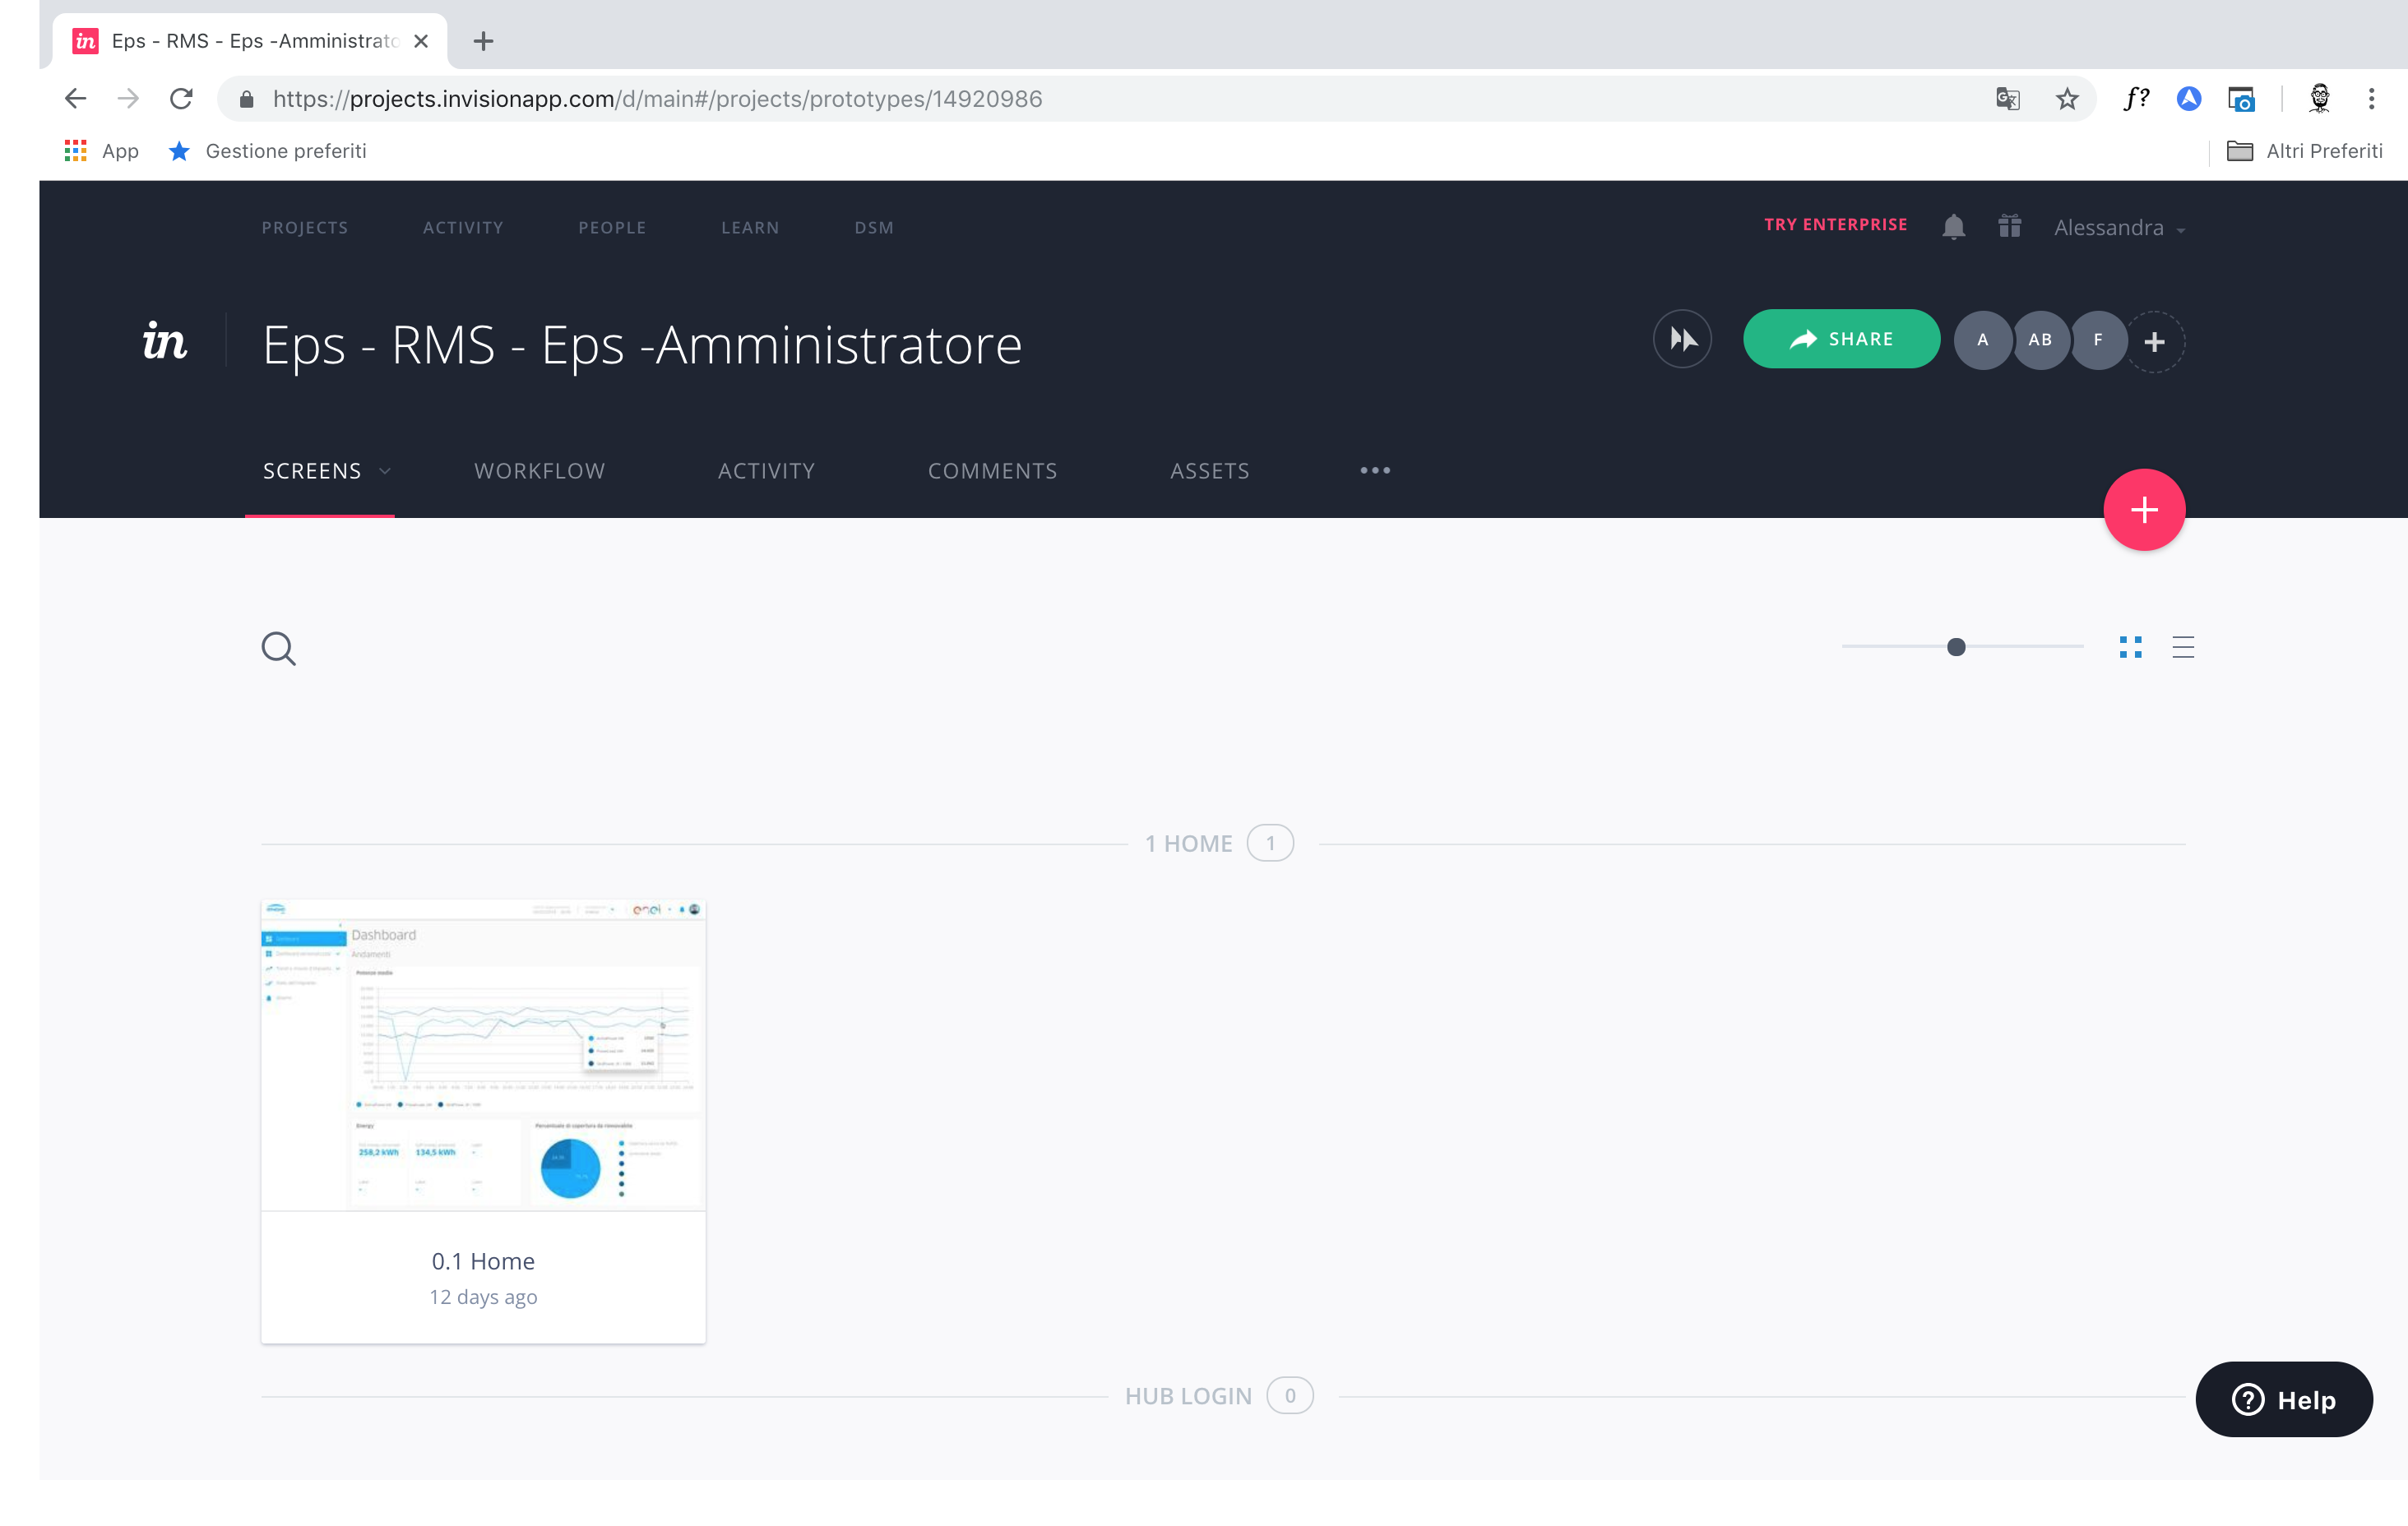
Based on these, screens were designed using the wireframe design system on sketch and prototypes shared on InVision. On Invision, it was possible to collaborate in order to define which type of graph to adopt for each data set.
Design
User interface
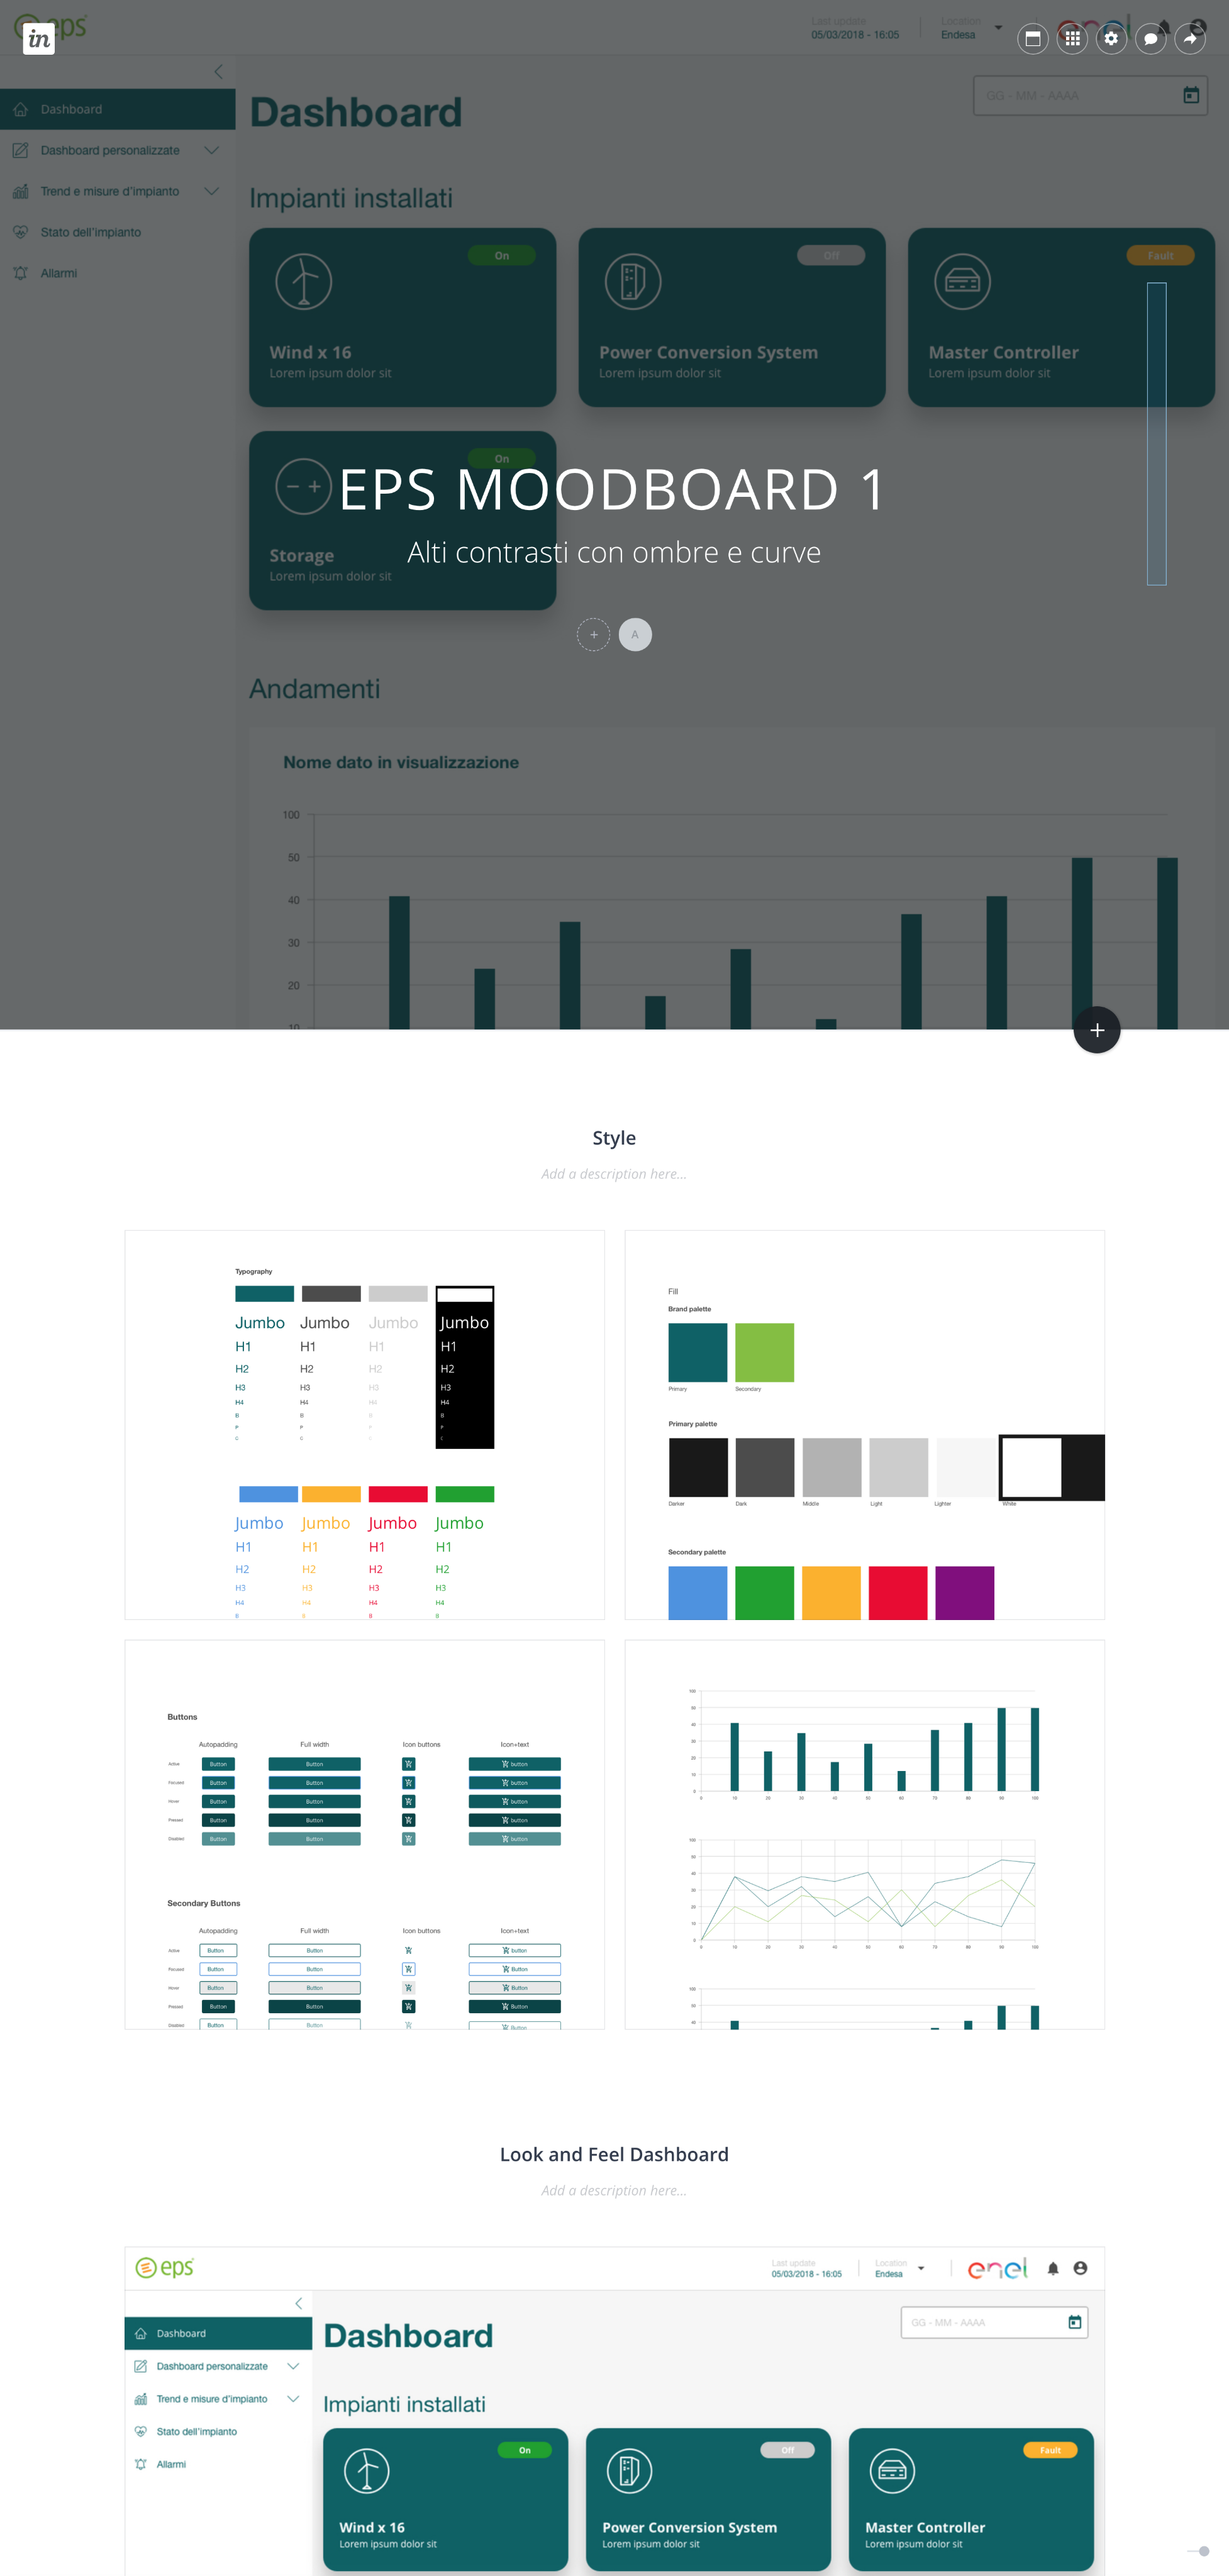
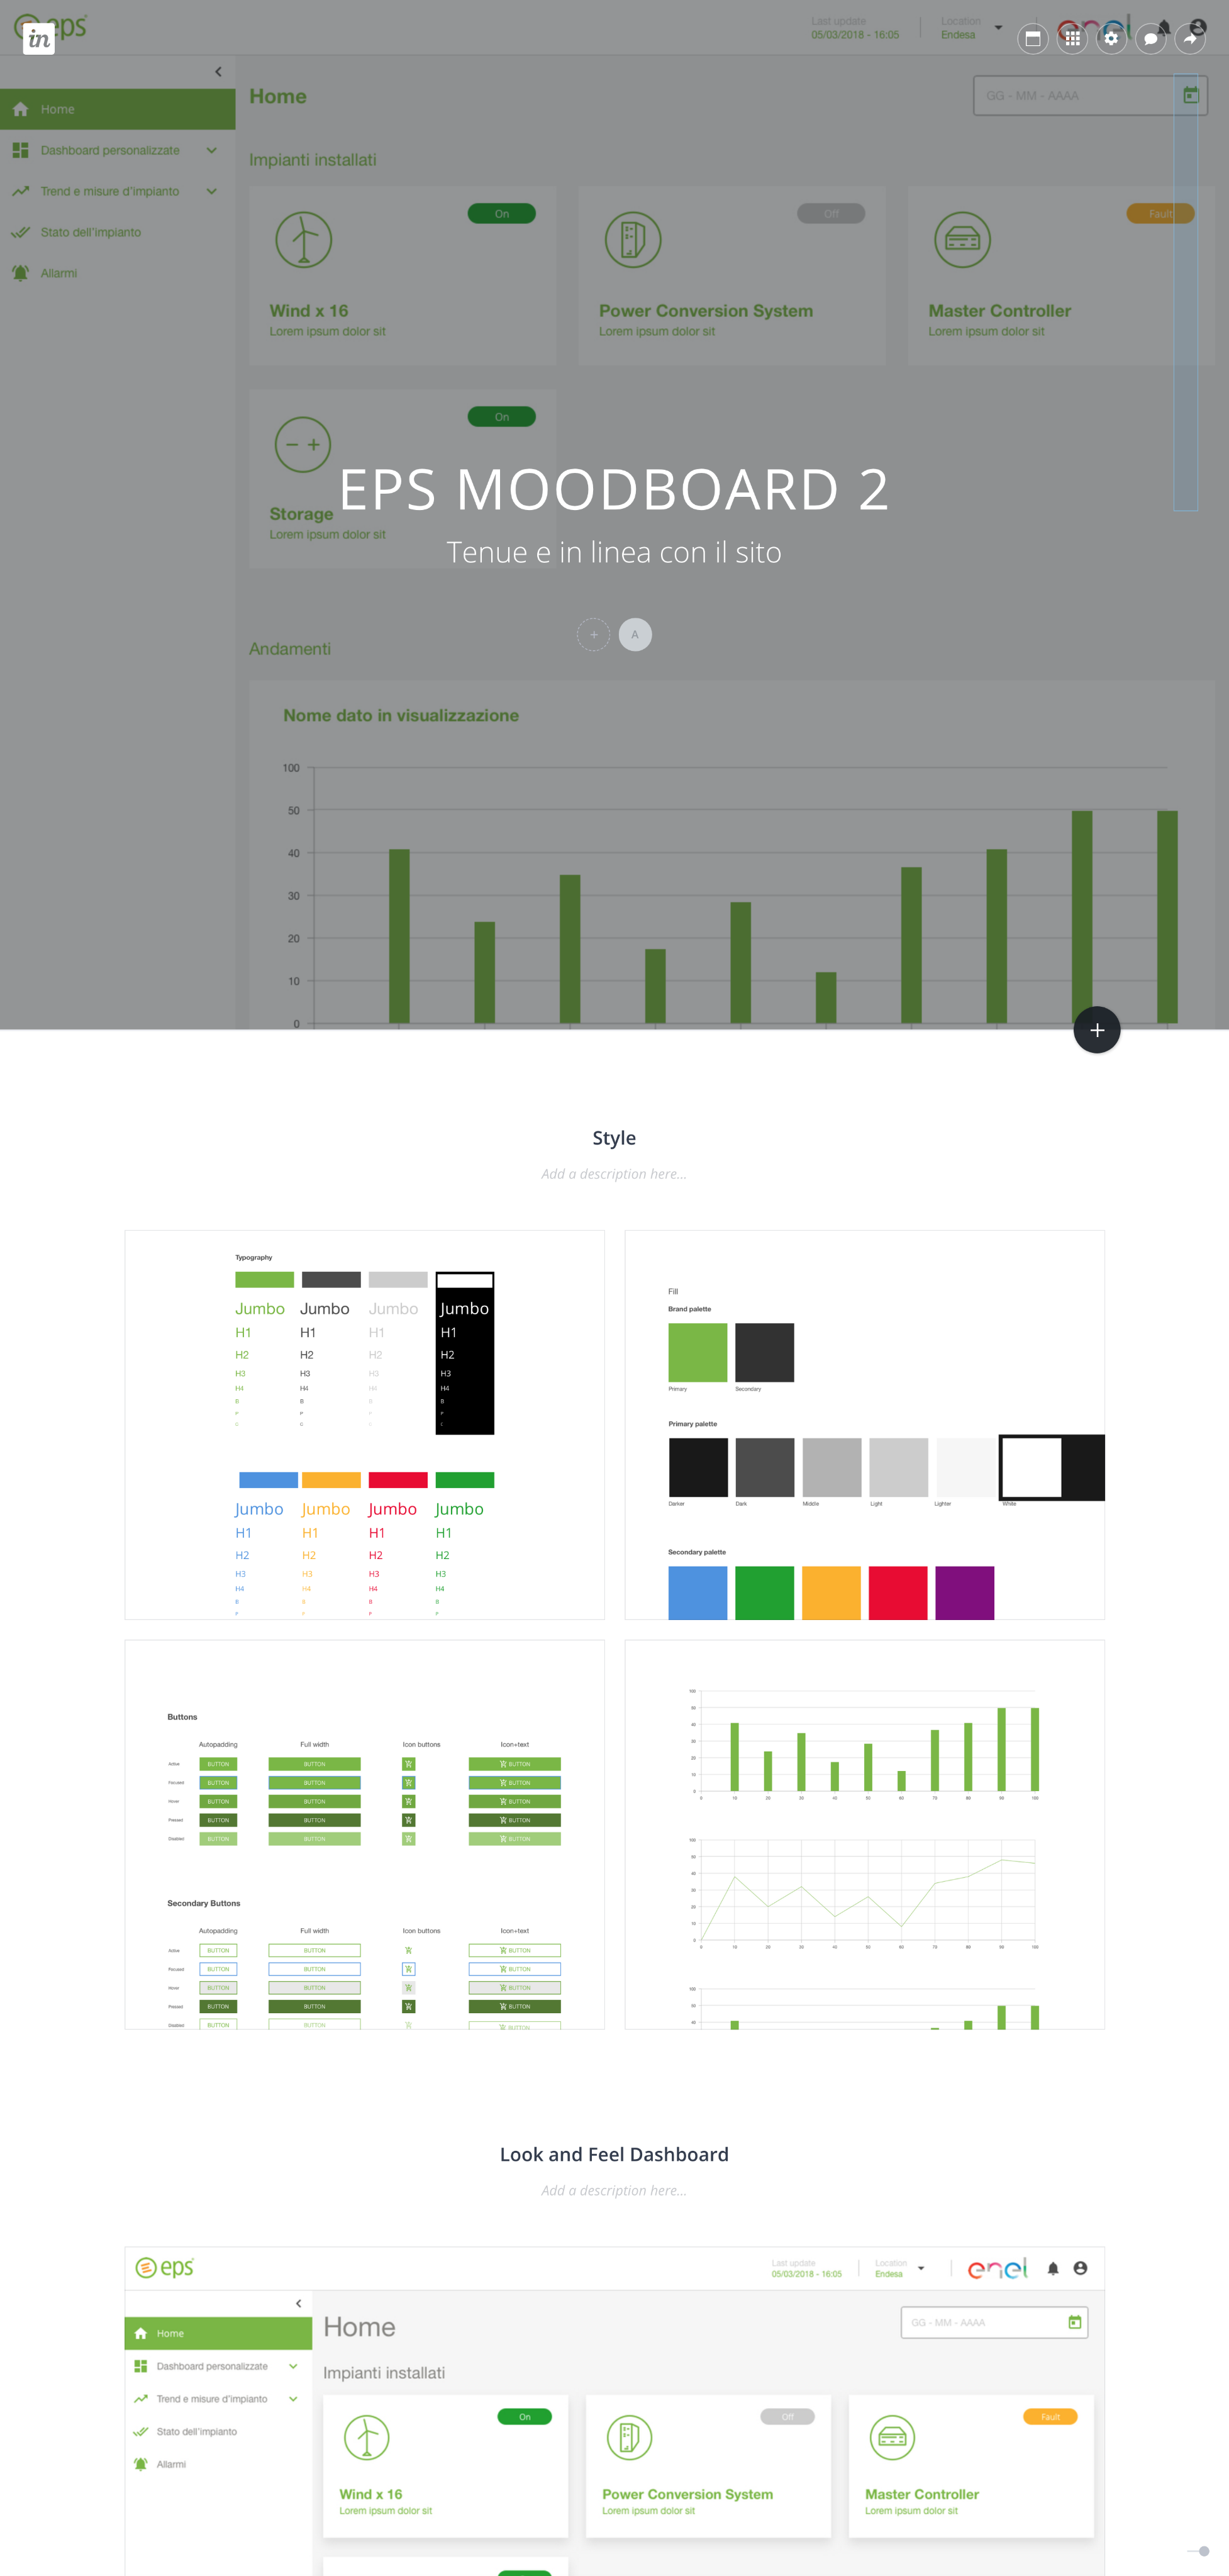
Parallel to gathering requirements on data and functionality, research was conducted on the visuals the web app should have. There was no brand book, so it was decided to propose two visual alternatives that were in line with the company’s other touchpoints.
Deliver
Design details
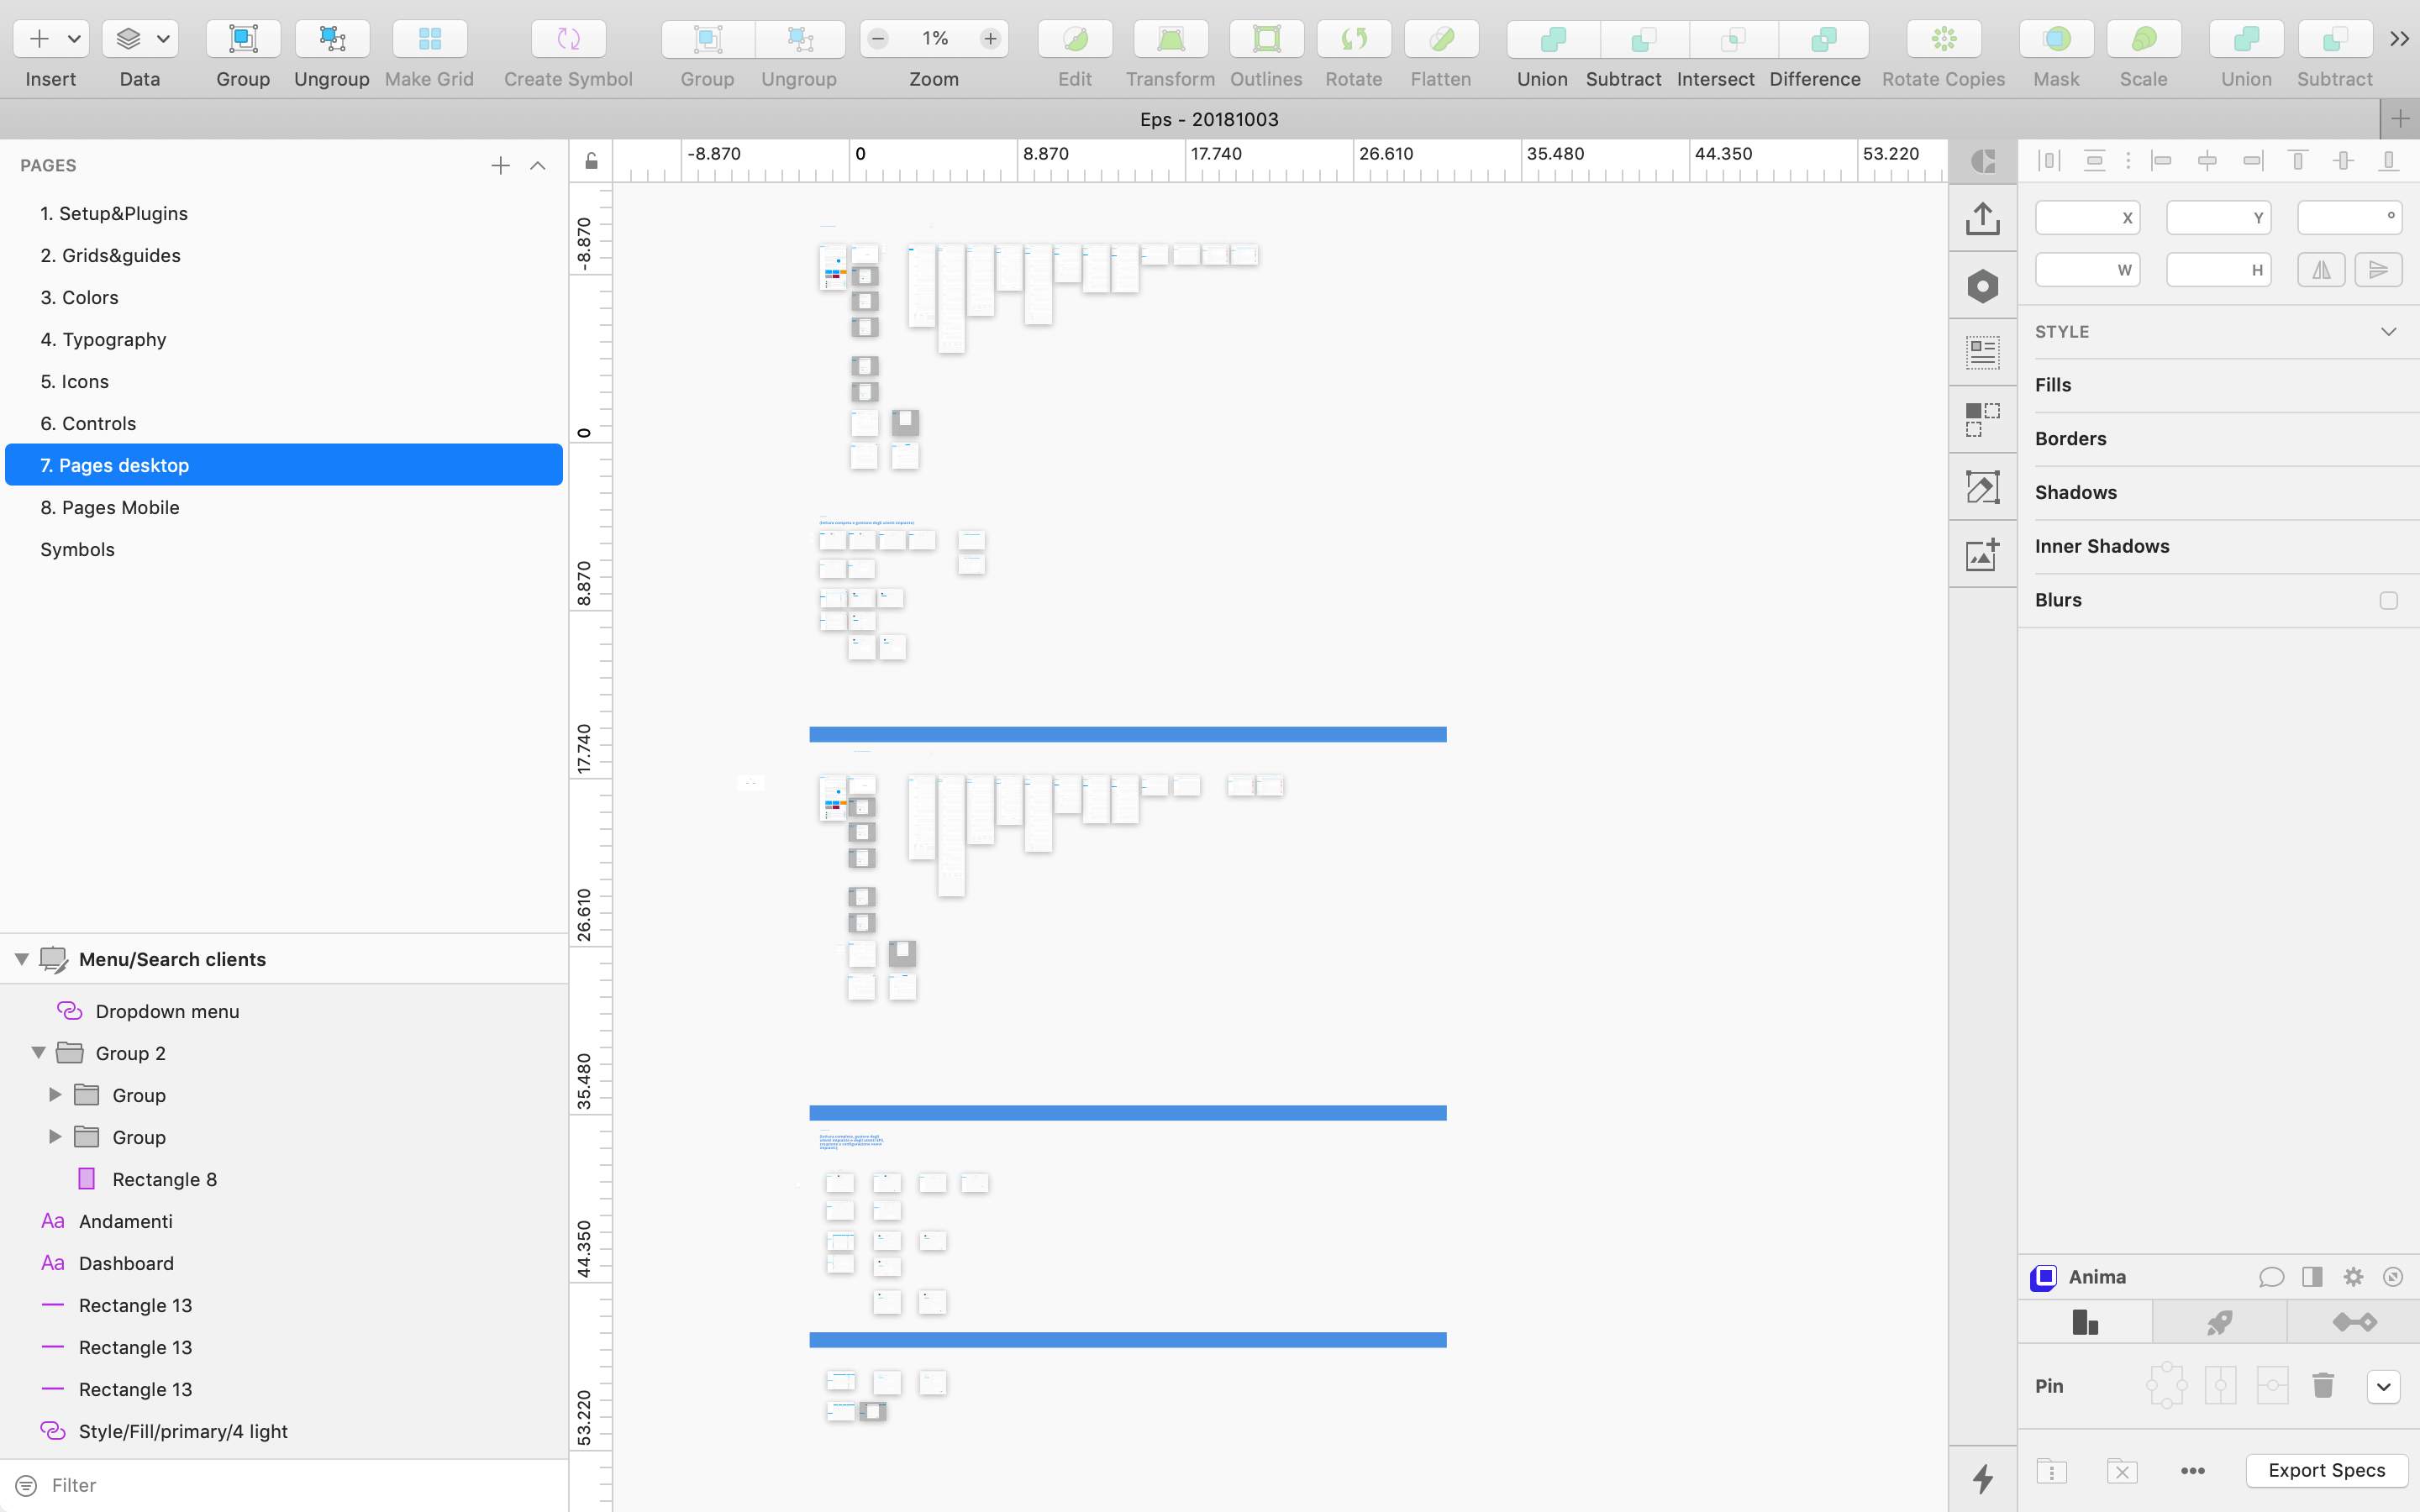
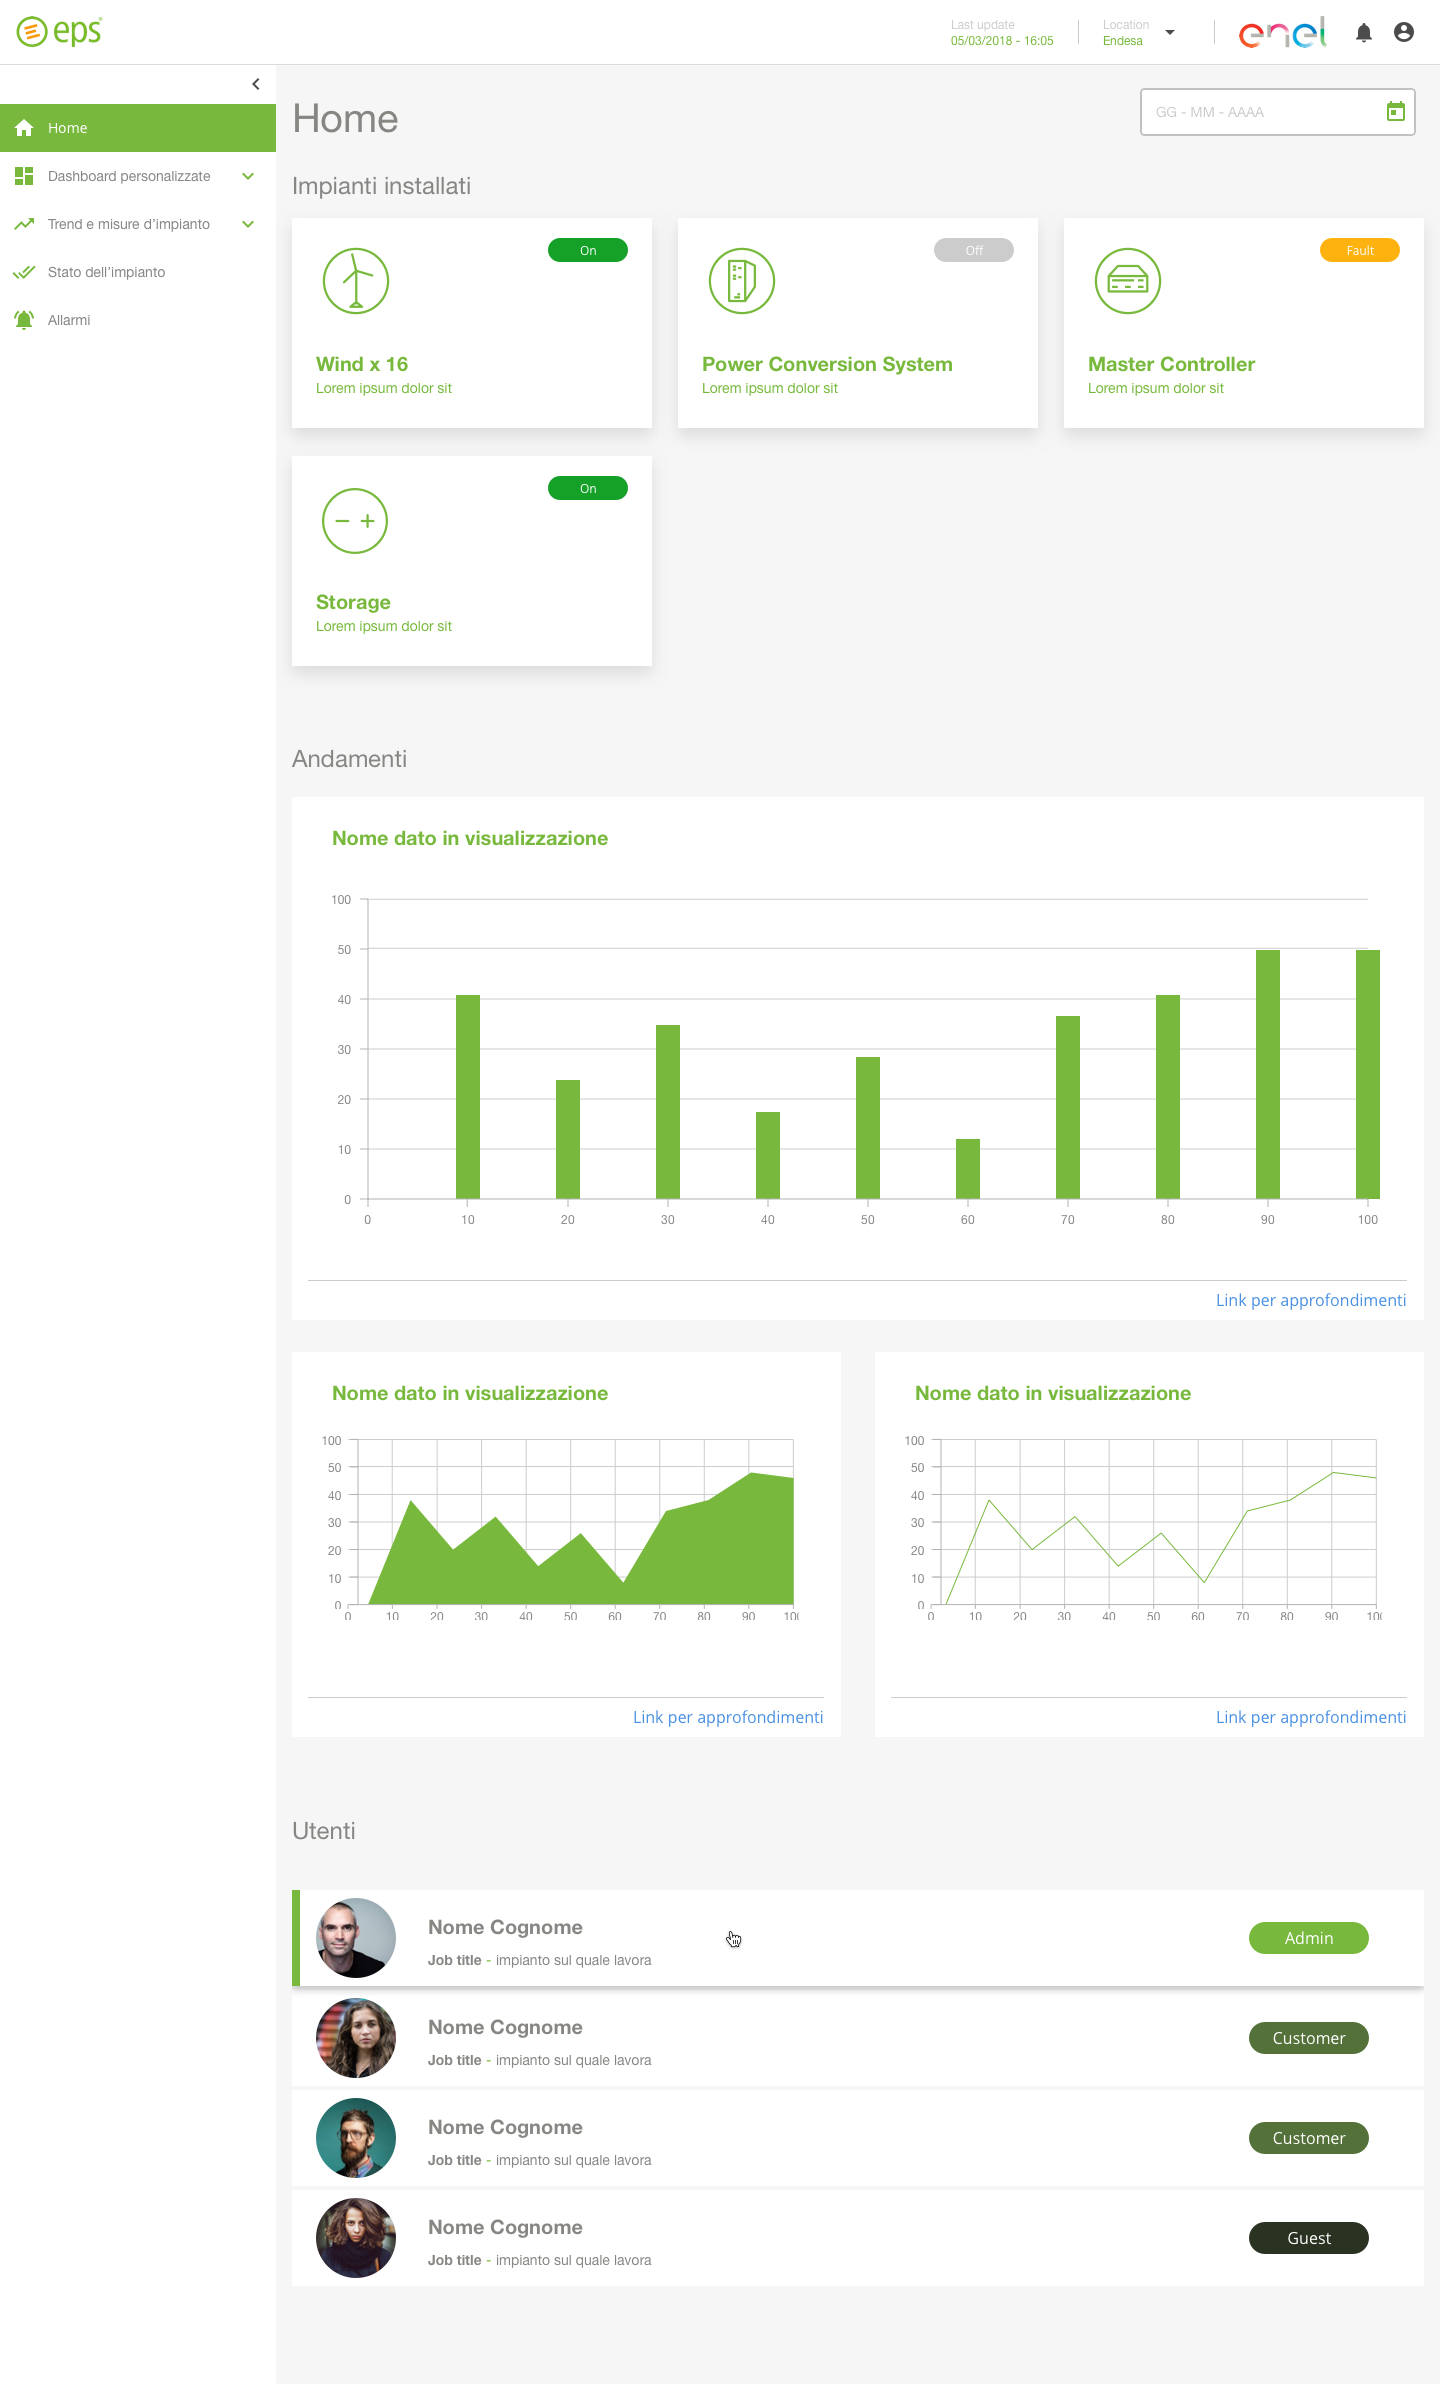
To speed up design operations, I worked by applying the visual chosen by the customer to a copy of the wireframe library. In this way, the new visual library inherited the component names. Consequently, it was very easy to update the prototype by replacing the wireframe components with the visual ones. The next step was to update the InVision screens, which still retained all the existing links.
Chance
Update visual faster
In the same way that I modified the wireframe prototype with the visual library, it was equally easy to update all touchpoints with the client’s branding requirements.
Thus saving hours already from the design phase. The project totalled 120h between design and gathering requirements.